
Seven of Earth’s 16 vital signs hit record extremes this year, and the planet’s warming rate has roughly doubled since 2010. A new report in BioScience says Earth’s systems are destabilizing, some at an accelerating pace, and that faster warming raises the risk of crossing irreversible tipping points.
Individually, each number is a warning. Read together, the 16 signs look like a planet running out of room to absorb what we are doing to it.
The scorecard: 16 signs at record extremes
| # | Vital sign | Latest reading | Status |
|---|---|---|---|
| 1 | Carbon dioxide | 428 ppm (May 2026), about 50% above pre-industrial | Record high |
| 2 | Methane | Nearly 2,000 ppb | Record high |
| 3 | Nitrous oxide | About 340 ppb | Record high |
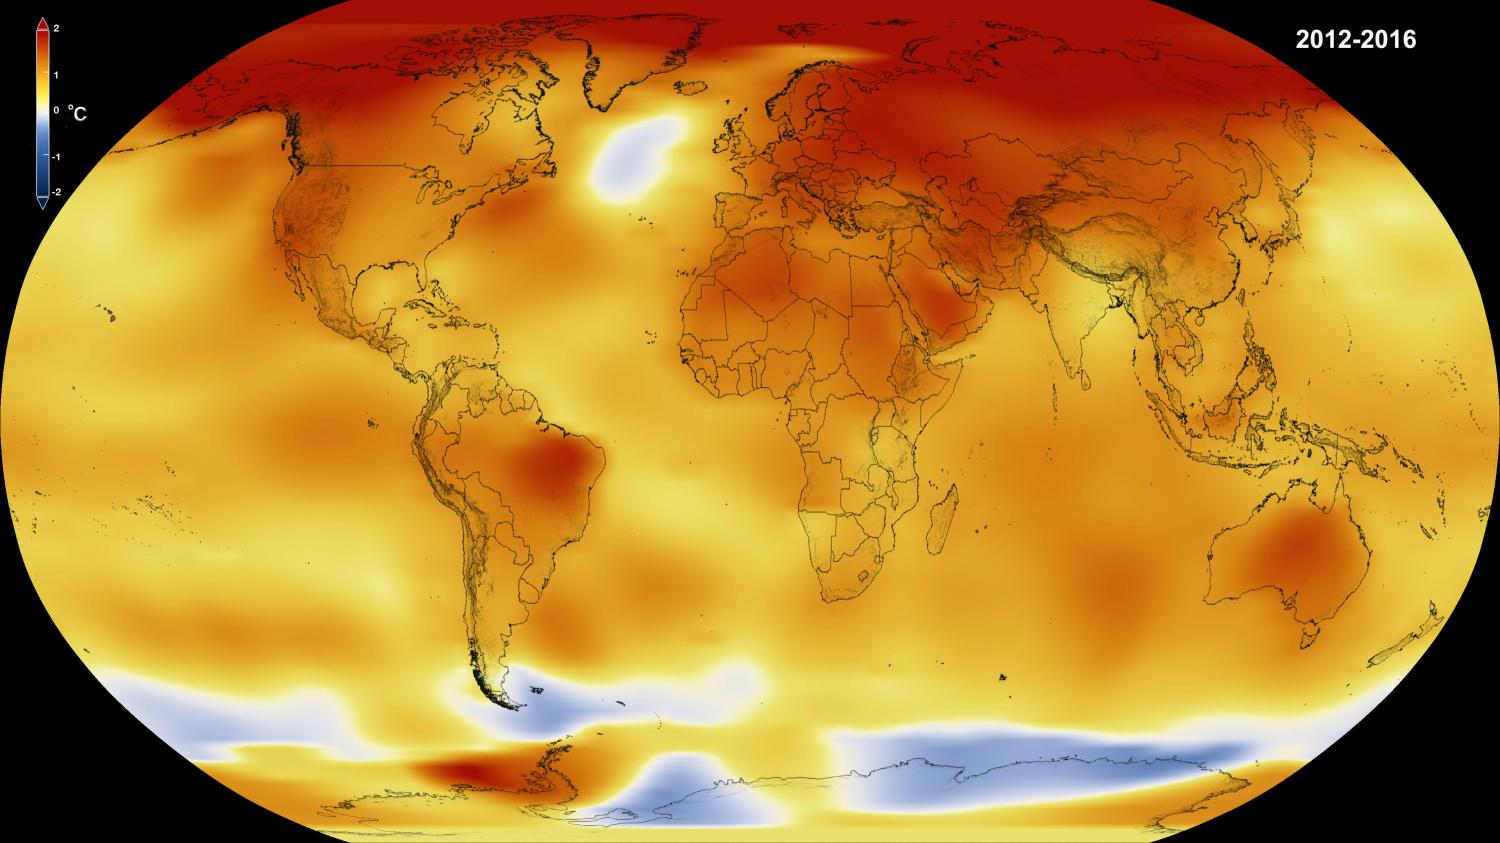
| 4 | Surface temperature | Around 1.5°C above baseline | Rising, rate doubled since 2010 |
| 5 | Extremely hot days | More than in 1961-1990 | Rising |
| 6 | Ocean heat content | Highest ever measured | Record high, accelerating |
| 7 | Earth’s energy imbalance | More heat in than out | Rising |
| 8 | Global albedo | Less sunlight reflected | Falling |
| 9 | Sea level | Highest since satellite records began in 1993 | Record high |
| 10 | Ocean acidity | pH 8.05 | Falling (more acidic) |
| 11 | Arctic sea ice minimum | About 4-5 million km² since 2010 | Well below earlier decades |
| 12 | Greenland ice sheet | About 6,000 gigatonnes lost | Record low mass |
| 13 | Antarctic ice sheet | Over 2,500 gigatonnes lost | Losing mass |
| 14 | Glacier thickness | Thinnest on record | Record low |
| 15 | US area burned by fire | About 2-4 million hectares a year | Up in recent decades |
| 16 | Tree cover lost to fire | Global loss increasing | Rising |
*Figures are approximate and drawn from the report’s published charts.
Signs 1-3: A blanket that only gets thicker

All three major greenhouse gases are at the highest levels ever recorded. They act like a blanket around the planet, letting sunlight in while trapping the heat that tries to leave.
Carbon dioxide passed 428 parts per million in May 2026, about 50% above pre-industrial levels. It comes mainly from burning coal, oil and gas, and worldwide use of all three still grew by 0.9% in 2025.
Methane has climbed to nearly 2,000 parts per billion. Over short timescales it traps far more heat than CO₂. Livestock, landfills and leaking gas infrastructure are major sources.
Nitrous oxide is at about 340 parts per billion, driven largely by fertilizers and farming.
Signs 4-8: Heat the planet can no longer shed

The headline here is speed. Global warming has roughly doubled its pace, from about 0.19°C per decade between 1970 and 2010 to about 0.36°C per decade since 2010.
4. Surface temperature now sits around 1.5°C above baseline, the level the world has spent years trying to stay under.
5. Extremely hot days keep climbing compared with 1961-1990. This is the sign people feel directly, in heat waves, failing power grids and crop stress.
6. Ocean heat content is at a record and rising at an accelerating rate. The oceans soak up most of the extra heat, so this is the planet’s hidden fever.
7. Earth’s energy imbalance measures the gap between the energy Earth absorbs from the sun and the energy it sends back to space. That gap is growing.
8. Global albedo, the share of sunlight reflected back to space, is trending down. As ice and snow shrink, darker surfaces absorb more heat, and that feeds more warming.
Signs 9-10: Oceans that are rising and souring
9. Sea level is at a record high. Warm water expands and melting ice adds more of it, so the climb continues year after year. For coastal cities and low-lying regions, this sign turns abstract numbers into flooded streets.
10. Ocean acidity has pushed pH down to about 8.05, from roughly 8.2 before industrialization. The ocean absorbs a large share of our CO₂, and that makes seawater more acidic, which harms corals, shellfish and plankton at the base of marine food chains.
Signs 11-14: The ice is going, and it does not come back
11. Arctic sea ice reaches its yearly minimum at around 4 to 5 million square kilometers, a level it has hovered near since 2010. Less ice means a darker Arctic that absorbs more heat.
12. The Greenland ice sheet has lost about 6,000 gigatonnes of mass, and its mass is at a record low. Greenland holds enough ice to raise global sea level by several meters if it were lost.
13. The Antarctic ice sheet has lost over 2,500 gigatonnes. Its western side is one of the regions scientists worry about most.
14. Glacier thickness is at a record low worldwide. Millions of people, including many across South Asia, depend on rivers fed by mountain glaciers for drinking water and farming.
Signs 15-16: The land starts to burn
15. Area burned in the United States has increased in recent decades and now runs at roughly 2 to 4 million hectares a year.
16. Tree cover lost to fire is rising worldwide. Forests normally pull CO₂ out of the air, so when they burn at scale they can flip from helping the climate to adding to the problem.
Why scientists are now talking about tipping points
A tipping point is a threshold beyond which a part of the climate system is so destabilized that it cannot return to its earlier state, even if warming stops. The report’s authors warn that accelerating trends raise the risk of reaching several of them. The ones researchers watch most closely are:
- The Atlantic Ocean circulation (AMOC), a current system that shapes weather across the Atlantic region and whose slowdown is among the risks scientists track.
- The Amazon rainforest, where runaway drying and deforestation could push parts of it toward a different, drier ecosystem.
- The Greenland and West Antarctic ice sheets, which could enter abrupt, accelerated melting.

The report does not claim any of these has been crossed. The concern is the direction and the speed. Outside climate scientist Nico Wunderling points to some evidence that it is the rate of climate change, not just the temperature level, that could trigger AMOC slowdown.
Report coauthor William Ripple of Oregon State University warns that continued warming could set off additional feedbacks and tipping points that make climate change increasingly hard to control.
The window is narrowing, not closed
There is one real bright spot. In 2025, renewable energy overtook coal in global electricity generation, and solar, wind and battery storage keep expanding fast. Ripple calls that an important turning point.
But the same report shows the gap between progress and need: worldwide oil, coal and gas use still rose 0.9% in 2025. The challenge is no longer whether clean technology exists. It is whether it can be deployed fast enough to actually push fossil fuel use down.
The authors also say cutting emissions will not be enough on its own, and that removing carbon from the atmosphere will be needed. That echoes a recent UN report saying the world will overshoot 1.5°C and must now work on carbon removal.
Found this article interesting? Subscribe to The Innovators Jam for articles, news, views, and write-ups on innovation, science and research.
Follow us on Instagram @theinnovatorsjam, Youtube @InnovatorsJam, LinkedIn @ The Innovators Jam




We would love to hear from you. Leave your reply here.